
So far I’ve looked at the CPU cores in M1 series chips using largely synthetic workloads, either generated using tight loops of assembly code in AsmAttic, or compressing test files using Apple Archive. Although these provide insight into how macOS manages threads on those cores, it reveals little about what happens during normal use. This article presents an analysis of one period of a few minutes during which there’s intense core activity, shortly after logging in following startup.
Background
There are two types of CPU core in M1 series chips:
- E cores contain roughly half the internal processing units of P cores, and have a maximum frequency of 2064 MHz.
- P cores have a higher maximum frequency, of either 3204 MHz in the original M1, or 3228 MHz in M1 Pro/Max/Ultra.
In this article, observations are limited to the cores in an M1 Max chip in a Mac Studio Max, which are essentially the same as those in the M1 Pro. These chips have 2 E cores and 8 P cores, arranged in three clusters: one cluster of two E cores, and two clusters P0 and P1 each containing four P cores. All cores within any given cluster are run at the same frequency, and generally (but not always) have their load balanced within that cluster. There are occasions when load is distributed more unevenly, and in exceptional cases, certain threads may be allocated to a single core.
macOS normally manages threads through Grand Central Dispatch using Quality of Service (QoS) settings. Those with the lowest QoS of 9 will only be run on the E cluster, while those with higher QoS can be assigned to either E or P clusters. macOS adopts a strategy where most, if not all, of its background tasks are run at lowest QoS. These include automatic Time Machine backups and Spotlight index maintenance.
In the original M1 chip, with its four E cores, QoS 9 threads are run with the core frequency set at about 1000 MHz (1 GHz). What happens in the M1 Pro/Max with its two E cores is different: if there’s only one thread, it’s run on the cluster at a frequency of about 1000 MHz, but if there are two or more threads, the frequency is increased to the maximum of 2064 MHz. This ensures that the E cluster in the M1 Pro/Max delivers at least the performance for background tasks as that in the original M1, at similar power consumption, despite the difference in cluster size.
A more detailed summary of previous work is in this article and many others here which precede it.
Methods
The only user-accessible tool which can provide measurements of power, frequency and active residency for cores and clusters is powermetrics. To obtain those, I have encapsulated its use in a privileged helper tool which can be triggered by the click of a button to collect data for 0.1 second sampling periods. This minimises the additional load which would be imposed by measurements at more frequent and regular intervals.
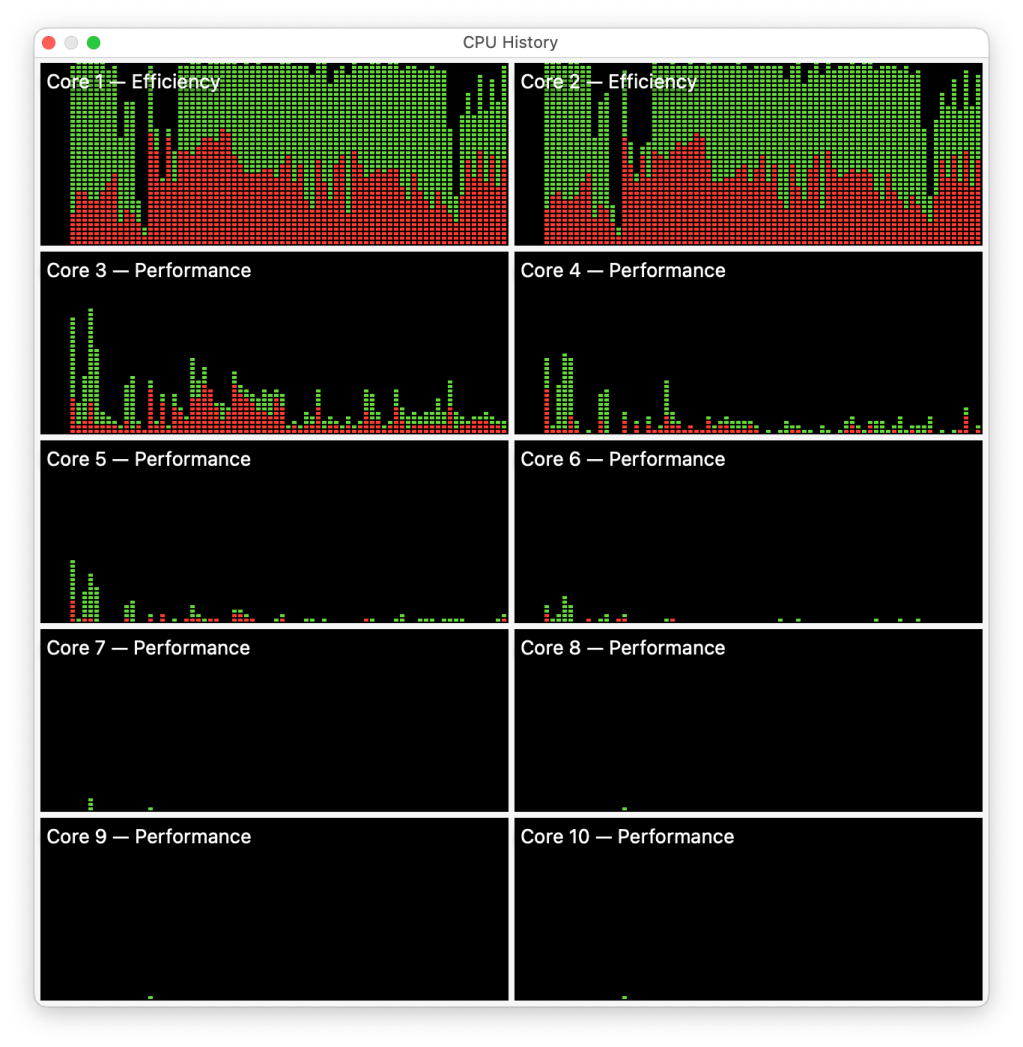
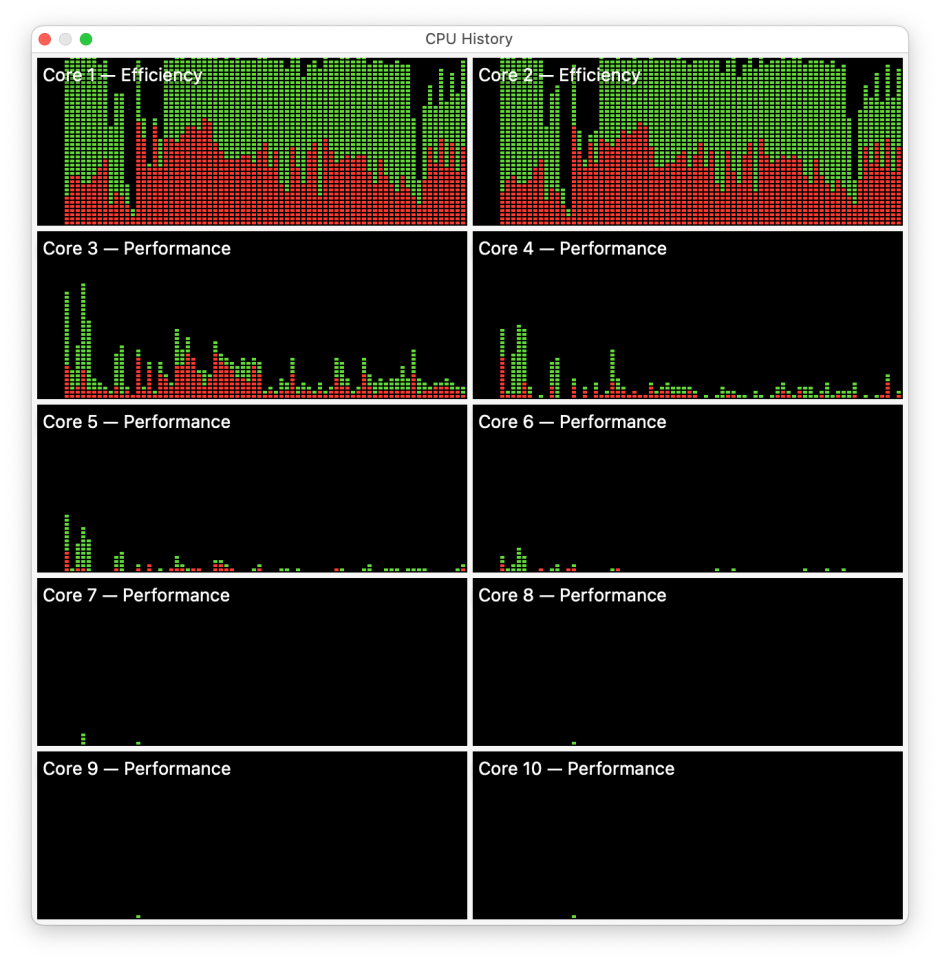
Immediately following user login, Activity Monitor was opened to provide graphical information about changing core load in its CPU History window, and powermetrics samples were collected at a rate of 2-5 per minute to gather a total of 22 representative samples covering the sequence of events over a period of just over 6 minutes after logging into an admin account on macOS 12.4, with no additional apps open. Events covered included the initial MRT scan and Spotlight indexing and database maintenance, concluding with a small and brief automatic Time Machine backup to an external SSD. The CPU History window below shows most of the first half of this period.
Results
The E cluster was heavily loaded for most of this period, with its power ranging from 28-621 mW. Its two E cores were run almost all the time at their maximum frequency of 2064 MHz, with short periods at 972 MHz when more lightly loaded. Active residency of each E core ranged between 6-100%.
The P0 cluster was less active, with relatively short bursts in which its power reached 1941 mW, but much of the time remained below 50 mW. Most of the time its frequency stayed at its minimum of 600 MHz, but rose in bursts to 3036 MHz. Its active residency remained low throughout, with a maximum of 26% per core, but most of the time it was less than 5%.
The P1 cluster remained essentially unused, with power between 7-19 mW, at a frequency of 600 MHz, and zero active residency.
These are shown in the following graphs.

Power used by each cluster shows a different picture from that seen in CPU History. The first P cluster (P0) draws large amounts of power for short peaks, while the E cluster uses less power throughout most of the period measured. P1 is essentially idle the whole time.

For each sampling period, powermetrics returns a range of different frequencies for each cluster, and each core. This graph shows the dominant frequency from each sample. The E cluster tended to switch between frequencies of 972 and 2064 MHz, as was seen in synthetic load studies. A wider range of frequencies was seen in the P0 cluster, something not found under more constant synthetic loads. So far, I have no insight into how macOS manages P cluster frequencies from these tests, but it appears more sophisticated than its management of E cluster frequency.

Active residency, given as the average percentage per core within each cluster, is also different from that shown in CPU History. While it remained at or close to 100% in E cores for long periods, it peaked at much lower values in the P0 cores, reaching a maximum of only 26% briefly at the start.
The simplistic method of expressing total CPU % as the sum of percentage active residency of each core, regardless of core frequency or type, can’t give an accurate representation of overall processing. For the purpose of comparison, I calculate a total in which measured active residency is scaled for frequency and type of core. It’s calculated as the sum of
(A * (F/Fmax) * T)
where A is the average active residency per core, F is the dominant frequency, Fmax is the maximum frequency of that core type, and T is a weighting relative to the P cores, where each E core is given a weight of 0.5, and each P core 1.0. For M1 Pro and Max chips, the simplistic approach gives a maximum total of 10 x 100% = 1,000%, whereas my scaled total gives a maximum of (2 x 0.5) + (8 x 1.0) = 900%.

This graph compares the simplistic sum with that scaled and weighted method, over the period of measurement. I haven’t attempted to adjust either to set their full-scale maxima to coincide, as by convention CPU % given in Activity Monitor doesn’t make any allowance for that, merely giving the raw total. This shows that, when viewed in the context of the available processing across all cores, for much of this post-login phase M1 CPUs have ample CPU % to spare.
While the simplistic total suggests a fifth or more of total CPU % is required, when properly scaled to take into account the core frequencies and types the load is only a ninth of the maximum for much of the time. This is reflected in the user perception of the post-login period: during this time on my eight-core Intel iMac Pro the fans run up audibly, and I’m used to leaving the Mac to settle down before I start opening apps. On the Mac Studio Max, the only sign that its cores are busy is if you open Activity Monitor to look.
The data from this single period of observation isn’t sufficient to look in more detail at relationships between variables, although there is one last graph which you may find interesting.

This shows the relationship between power for the E cluster and its total CPU % calculated as above. The curve fitted, with a little imagination, has the equation
power = 48.622 + (0.048887 x (CPU^2))
suggesting the expected non-linear relationship in which higher load results in disproportionately higher power consumption.
Conclusions
- In real-life use, E cores are normally managed by macOS to run at frequencies of 600 MHz (idle), 972 MHz (one or few threads) or 2064 MHz (multiple threads), with cluster power up to 621 mW.
- When running macOS tasks, P cores are commonly used only in brief bursts at a wider range of frequencies, with cluster power up to 2,000 mW.
- macOS strategy is to load E cores heavily with system tasks, and spare P cores for user tasks. This ensures the user is unaware of and unaffected by heavy system workloads. It also minimises battery use in notebooks.
- A scaled and weighted total CPU % gives a more accurate reflection of overall core activity.
- Try doing this with SMP!
