
Following my article yesterday demonstrating with synthetic tests that Activity Monitor’s CPU % and Energy measurements are misleading, today I show how you can get accurate estimates of power and energy use, and how the E cores in M1 chips can be far more efficient than the P cores. Today’s compression task required less than a third of the energy when run on the E cores, than on the P cores.
The task
Because I’m going to use powermetrics for energy measurements, I’m using a test task which can take between 0.6 and 5 seconds to complete on my Mac Studio Max. My free compression/decompression utility Cormorant typically achieves that with 1 GB test files, and already has a simple user control to set the Quality of Service (QoS) for processing files.
Activity Monitor
Running the test task with Activity Monitor’s Energy pane open, I measured and calculated:
- At maximum QoS (33), the task reached 260 energy units and took 0.6 s, giving 156 units.s.
- At minimum QoS (9), the task reached 160 energy units and took 5.0 s, giving 800 units.s.
If you were to believe those figures, running on the E cores is far less efficient than using the P cores, by a factor of 5.
powermetrics measurements
Although it’s a bit fiddly, what I then did was set Cormorant up ready to compress the test file, and had ready in Terminal a command like
sudo powermetrics -i 100 -o filename.txt -n 50 --samplers cpu_power
All powermetrics commands have to be run as root, so you’ll need to preface them with sudo and enter your password before they start. The rest of the command is composed of:
-i 100to set each sample period to 100 ms, i.e. 0.1 s-o filename.txtto save the output to the file named filename.txt-n 50to collect a total of 50 samples, which covers a total of 5 s--samplers cpu_powerto collect only those measurements covering core frequency and power.

With both windows ready, I pressed Return in Terminal to start the data collection, then clicked Open in Cormorant to start the test task. powermetrics then starts sampling immediately before the task starts, and that completes before sampling ends. I repeated this with a compression at high QoS, and then with one at low QoS, providing me with two text files full of measurements on the cores.

Rough estimate
Before reaching for the spreadsheet or charting app, it’s worth making a rough estimate of the total energy used by the two test compressions, using an eyeball average of power for the active periods and multiplying that by the time taken to complete the task. Here:
- Compressing on the E cores, that’s 620 + 9 + 9 for the cluster total, then multiply that by 5 = 3200 mJ = 3.2 J.
- Compressing on the P cores, that’s 620 + 9500 + 9500 for the cluster total, times 0.6 = 11.8 J.
Contrary to Activity Monitor, it now looks as if compressing at low QoS on the E cores uses a third of the energy as the P cores.
Details
powermetrics provides a great deal of detail, including cluster frequencies and active residencies. All I’ll dip into here are those power measurements, though.
I’ll start with simple charts showing power use reported per core cluster over time.
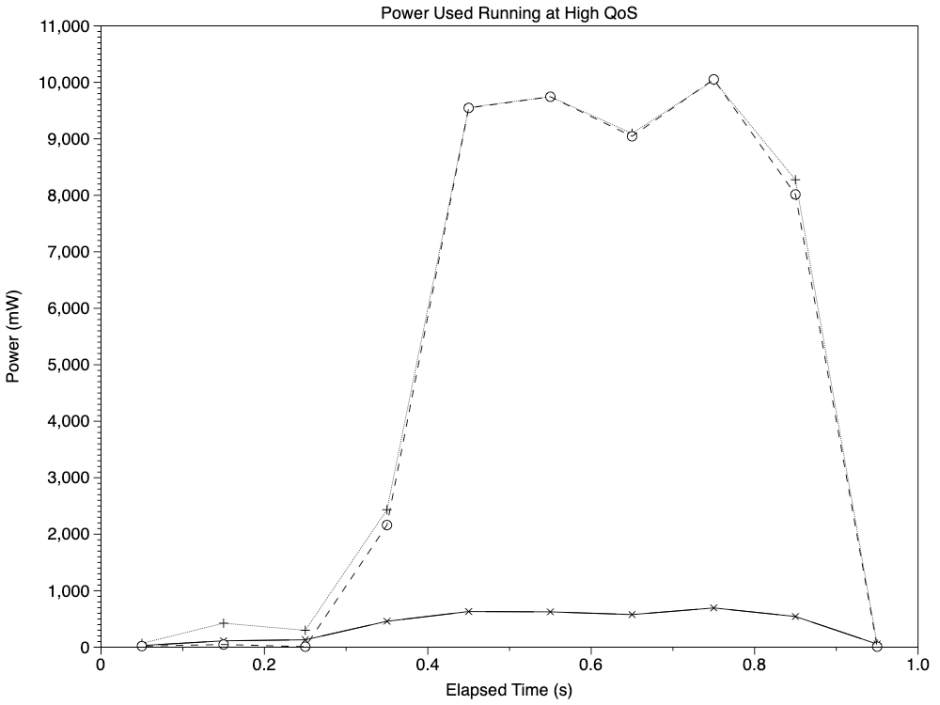
When run at high QoS, largely on the P cores, the test task completes in around 0.6 seconds as expected, with the two broken lines representing the two clusters of P cores reaching high power, just short of 10 W. The lower solid line shows power consumption for the cluster of two E cores on this M1 Max chip, which rise slightly, but remain far below the P clusters.
Conventional wisdom, at least for SMP chips, is that this is the most efficient strategy, as it gets the task out of the way as quickly as possible.
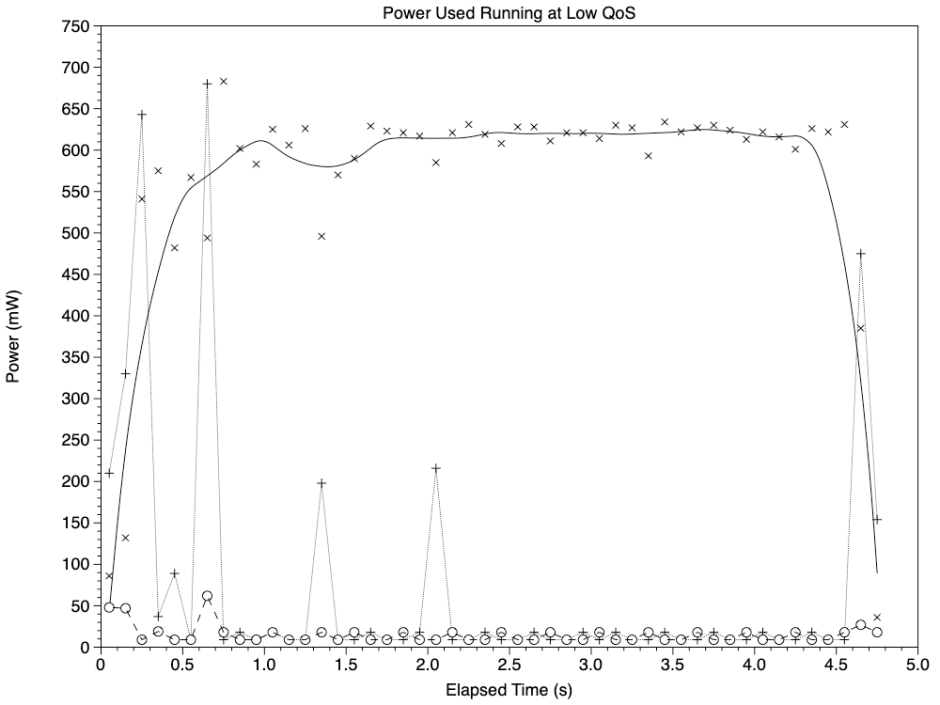
This is what happened at low QoS, when the brunt of the work was performed on the E cores. Again, the solid line shows the power use of the cluster of two E cores, which draw around 600 mW for the most part of the nearly 5 seconds required. The two broken lines show the power use of the P core clusters, which show short and relatively low peaks, mostly at the start and the end.
To see energy use for each task, we need the area under those curves. This is readily calculated in a cumulative sum of the total core power use; as each measurement is averaged over a period of 0.1 s, to express energy in Joules we need to multiply by 0.1 (the time period of each measurement) and divide by 1,000 (mJ into J). This provides the graph below.

Total energy used by the high QoS test (x points, solid line) is 10.3 J, and that for the slower low QoS test (+ points, dotted line) is only 3.1 J. These are close to the initial rough estimate, and confirm that running on the E cores uses 30% of the energy as running on the P cores. On a notebook running on its battery, that’s a substantial difference. It’s also exactly the reverse of what’s shown in Activity Monitor’s Energy pane.
Conclusions
If you have an app which runs threads that could be more energy efficient when run at a background QoS, now’s the time to give the M1 user that option. If you use your M1 notebook on battery, now’s the time to look for apps which give you the choice to extend the endurance of its battery.
