
When you read in more depth at all the tricks that M1 chips and their CPUs pull, it’s quite bewildering. To try to simplify my little performance tests, I’ve resorted to traditional techniques using assembly language. In a bid to avoid cunning strategies such as out-of-order execution, differences in cache memory, and in main memory access times, I’ve resorted to running tight loops which rely only on accessing registers – and they’re complicated enough. This article reports further results from comparing Firestorm (performance, P) with Icestorm (efficiency, E) cores, as well as providing an updated version of my test app, AsmAttic 4.5.
This new version of AsmAttic offers six tests:
- An ’empty’ loop containing just two integer instructions, one to decrement the loop counter, the other to increment register X0, which is returned as the result. According to Dougall Johnson’s measurements, these amount to a total latency of 2, on both P and E cores.
- A 64-bit integer math loop, which includes a fused multiply-add instruction and a signed divide, bringing its total latency to 11-13 for a P core, and 11-25 for an E core.
- A 64-bit floating-point math loop, which includes a fused multiply-add instruction and a divide, with a total latency of 21 on P and E cores.
- A NEON SIMD dot product loop, working with four-long vectors of 32-bit floating-point, with a total latency of 14 on P and E cores.
- An equivalent dot product calculation on four-long vectors of 32-bit floating-point using Apple’s Accelerate library from compiled Swift.
- Some tortured compiled Swift calling a mixture of integer/ALU and floating-point operations which could extend beyond registers.
As with my last series of tests, I have measured the time taken to complete different numbers of identical processes running at different QoS levels for macOS to assign them to different cores. At low QoS, these have run 1-4 processes on the E cores in an original M1 chip, and 1-2 processes on those in an M1 Pro. At high QoS, these have run 1-8 processes on the P cores in an M1 Pro.
In each case, I have plotted the overall time taken to complete all the test processes against the number of processes run. Although those processes are normally distributed across all the cores in a cluster, the total CPU % shown in Activity Monitor equals that expected if processes had been allocated to single cores. For example, running 2 processes at low QoS on an original M1 results in their being run exclusively on the E cores at an indicated 200% CPU, with each of the four E cores averaging around 50% CPU.
Further details are given in my previous articles:
How can you compare the performance of M1 chips? 2 Core allocation
Comparing performance of M1 chips: 3 P and E
Comparing performance of M1 chips: 4 Icestorm
Do M1 Pro and Max CPUs run slower on battery?
Results
Each of these graphs is very similar, so I’ll explain how they work using the empty loop as an example.

Looking first at the solid line, that’s a linear regression through the loop throughputs measured as 10^9 loops per second, against the number of processes run on P cores. That has a gradient of almost 3, indicating that each P core runs this minimal loop at a rate of 3 billion loops per second. The broken line is the equivalent regression for the four E cores in an original M1 chip, each of which runs the loop at a rate of 1 billion loops per second, a third of a P core.
There are also two points plotted with an x which start on the regression line for the E cores, but rise sharply above it for 2 processes. Those are the results from the two E cores in an M1 Pro chip. With a single process running on them, they follow the performance of the E cores in the M1, but loading a second process results in a loop throughput which matches the total of all four E cores in the M1. That occurs despite the observation in Activity Monitor’s CPU History window that, at that QoS, the test processes are confined to the two E cores alone.
This pattern repeats with the other three assembly language tests.
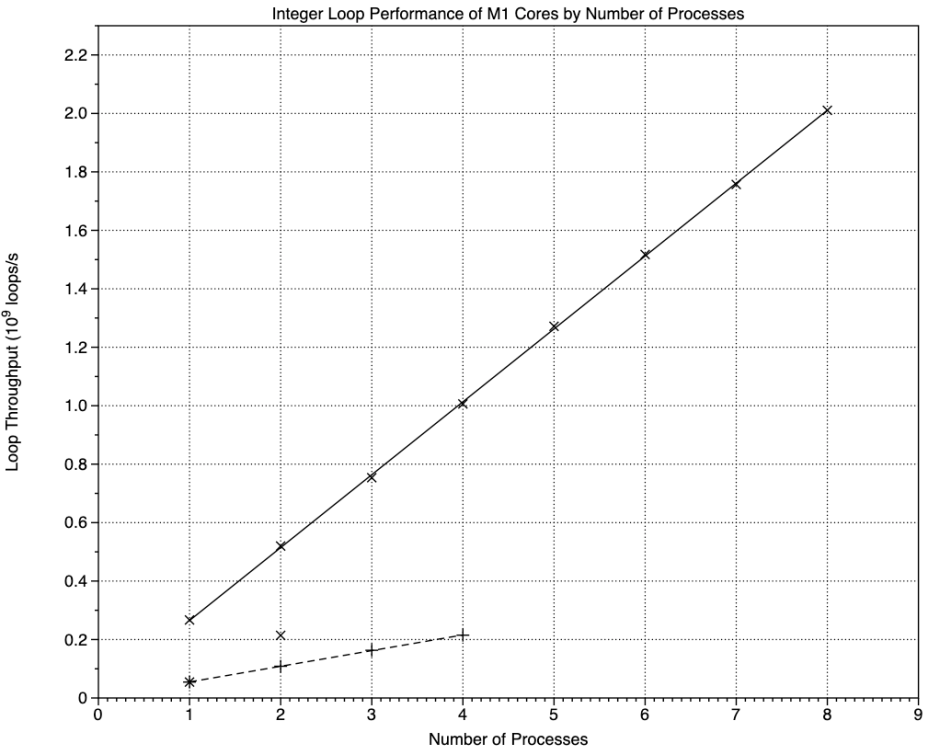
These are the results for the integer test, with a greater difference in slopes between the E and P cores. Instead of an E core being about 0.32 of a P core, in this test it’s about 0.21. However, using both the E cores in an M1 Pro still results in the same throughput as all four E cores in the original M1.

These are the results for the floating-point test, which has an E/P ratio of 0.32, as with the empty loop. Again, throughput of the two E cores in the M1 Pro is approximately the same as that for all four E cores in the original M1.

NEON is very similar to floating-point, with an E/P ratio of 0.35, and the same high throughput of two E cores on the M1 Pro.

In this case, I believe that Apple’s Accelerate library calls very similar code to that used in the NEON test. Although the E/P ratio is slightly lower, at 0.27, the same high throughput is seen for two E cores in the M1 Pro. P and E throughput values are very similar to those of the NEON test.

Results from the mixed test scatter more from the regression line at higher process numbers, suggesting that more complex factors come into play. The E/P ratio is the lowest of all the tests at 0.19, but the second E core in the M1 Pro still results in throughput comparable with all four E cores in the original M1.
Conclusions
Results from four separate tests of tight loop performance coded in assembly language confirm that E core performance is around 0.2 to 0.35 that of a P core. However, there’s a marked anomaly when both the E cores in an M1 Pro are fully loaded, as they then appear capable of matching the loop throughput of all four E cores in the original M1. Other than hypothesising that the E cores in the M1 Pro could run at a clock speed higher than the P cores, I can see no explanation for this anomaly, which is striking in all my test results, across both ALU and Floating-point/NEON units.
If you think you have an explanation, I’d love to hear it, please.
AsmAttic
Version 4.5 is now available from here: asmattic45
This includes a PDF which gives fuller source code for the tests used here. It’s ARM64 only, and notarized.
Appendix: Regression results and code
Empty Loop Code:
mt_while_loop:

SUBS    X4, X4, #1

B.EQ    mt_while_done

ADD     X0, X0, #1

B       mt_while_loop

mt_while_done:
Regressions:
E 0.018776 + 0.9595x
P 0.18824 + 2.9894x
E/P 0.32
Integer Code:
int_while_loop:

SUBS    X4, X4, #1

B.EQ    int_while_done

MADD    X0, X1, X2, X3

SUBS    X0, X0, X3

SDIV    X1, X0, X2

ADD     X1, X1, #1

B       int_while_loop

int_while_done:
Regressions:
E 0.0012658 + 0.053599x
P 0.01569 + 0.24938x
E/P 0.21
Floating-point Code:
fp_while_loop:

SUBS    X4, X4, #1

B.EQ    fp_while_done

FMADD   D0, D4, D5, D6

FSUB    D0, D0, D6

FDIV    D4, D0, D5

FADD    D4, D4, D7

B       fp_while_loop

fp_while_done:
Regressions:
E 0.0009792 + 0.04786x
P 0.0077968 + 0.15026x
E/P 0.32
NEON Code:
dp_while_loop:

SUBS    X4, X4, #1

B.EQ    dp_while_done

FMUL    V1.4S, V2.4S, V3.4S

FADDP   V0.4S, V1.4S, V1.4S

FADDP   V0.4S, V0.4S, V0.4S

FADD    V2.4S, V2.4S, V4.4S

B       dp_while_loop

dp_while_done:
Regressions:
E 0.010683 + 0.31687x
P 0.056851 + 0.89509x
E/P 0.35
Accelerate Code:
for _ in 1...theReps {

tempA += simd_dot(vA, vB)

vA = vA + vC }
Regressions:
E 0.0033636 + 0.24009x
P 0.046368 + 0.8791x
E/P 0.27
Mixed Code:
for _ in 1...theReps {

tempA = zip(vA, vB).map(*).reduce(0, +)

for (index, value) in vA.enumerated() {

vA[index] = value + vC[index]

} }
Regressions:
E 5.788e-5 + 0.0011451x
P 0.00093599 + 0.0060069x
E/P 0.19
