
So far in this series looking at comparing the performance of the cores in M1 series chips, my attention has largely been devoted to processes running at high Quality of Service (QoS), resulting in them being scheduled first and foremost on the Firestorm performance (P) cores. Only when they are fully loaded does macOS schedule processes with high QoS on the Icestorm efficiency (E) cores. This article looks at the opposite end: processes which are given the lowest QoS, to be run as background services. Those include most of the everyday services in macOS, together with any designated by third-party software.
It was last May that I reported that using the lowest setting for QoS resulting in processes running exclusively on the E cores in an M1 Mac. Since then we’ve gained M1 Pro/Max chips which behave qualitatively the same. Using the same tests that I ran at high QoS in my last article in this series, I can now provide a quantitative comparison between both the core types in the original M1 and new M1 Pro chips. For full details of the tests and methods used, see that last article.
The only difference in the methods used to examine the E cores is that the maximum number of processes is limited to 5 on the original M1, with its 4 E cores, and 3 on the M1 Pro, with its 2 E cores. Numbers of test loops were also adjusted to cope with the different performance of the E cores.
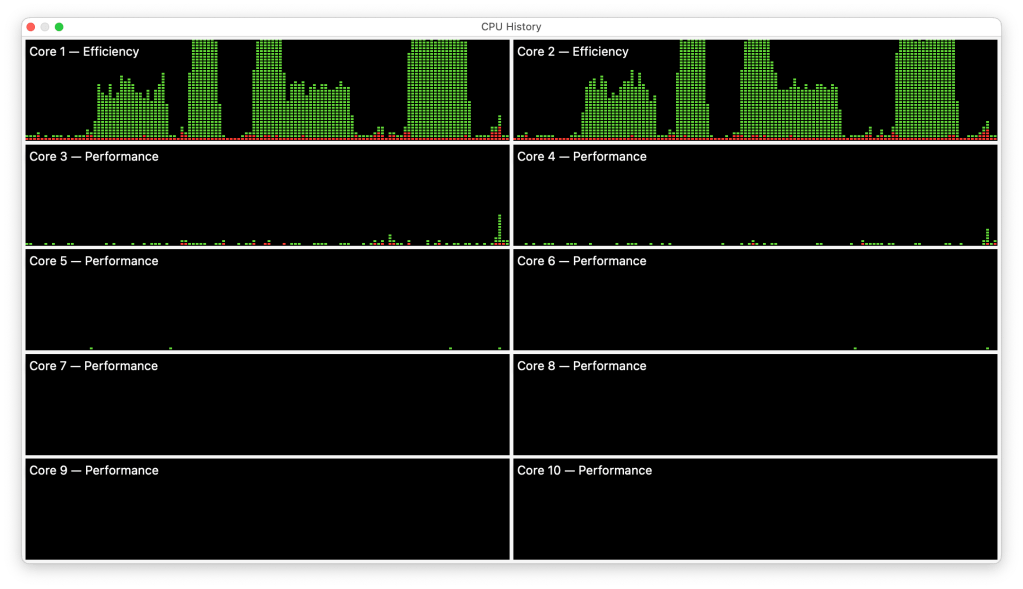
All tests run at minimum QoS were confined to the E cores as expected. In this sequence on my M1 Mac mini, the number of processes increases from 1 at the left to 4, 6 and 8 at the right. As noted before, rather than cores being recruited individually, for the whole series the load is shared fairly evenly across all the cores in the E cluster, and there’s no use of the P cores at all.
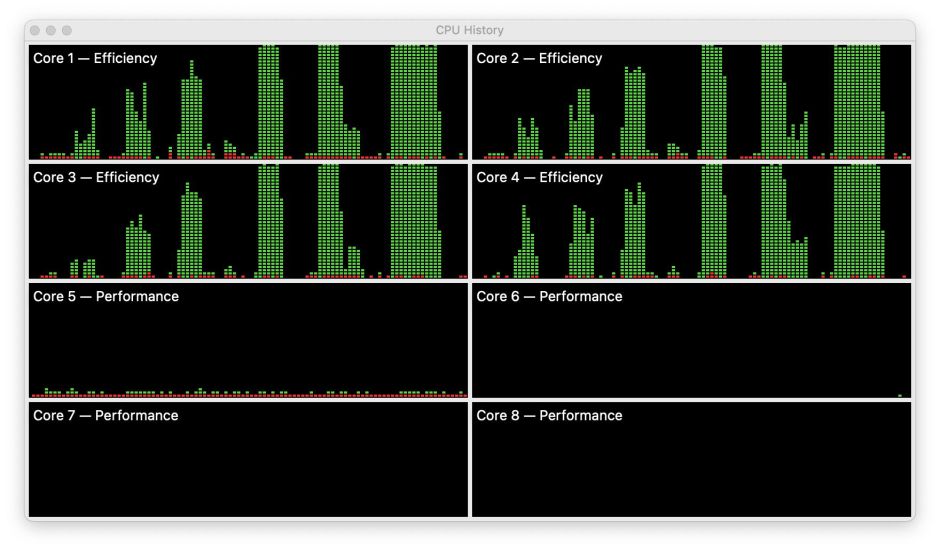
Here’s a similar sequence of 1-4 processes on the M1 Pro. Although the CPU % for the single process (left) was given as 100%, it was shared evenly over the two E cores, and the eight P cores remained near idle throughout. There’s one tantalising detail which you might not otherwise notice: the width (duration) of the second test with 2 processes is obviously smaller than the first test with a single process. Similarly, the peak of the third test with 3 processes is narrower than the first test.
Results
I now have measurements of loop performance for the same five tests running exclusively on 1-8 P and 1-4 E cores on the two chips. To compare these here, I show graphs of the loop performance, expressed as billion (10^9) loops/second, against the number of processes, which is the same as the number of cores (although in some cases the total is shared across a greater number of physical cores than processes).

Taking the Integer test first, this graph combines the measurements made on the P cores, shown with a solid linear regression line, with those on the E cores, with the broken regression line. Data points from the original M1 are shown using +, and those from the M1 Pro as x.
Performance for the P cores is identical between the M1 and M1 Pro, and reflects the significantly higher performance of those cores. Integer performance of the E cores of the M1 is considerably lower, as expected given its ‘half P’ design and lower clock speed. There is, though, one obvious outlier, and that’s the performance achieved by two processes running on the M1 Pro, which is about double that of the M1, although it’s still significantly lower than a single process on a P core.
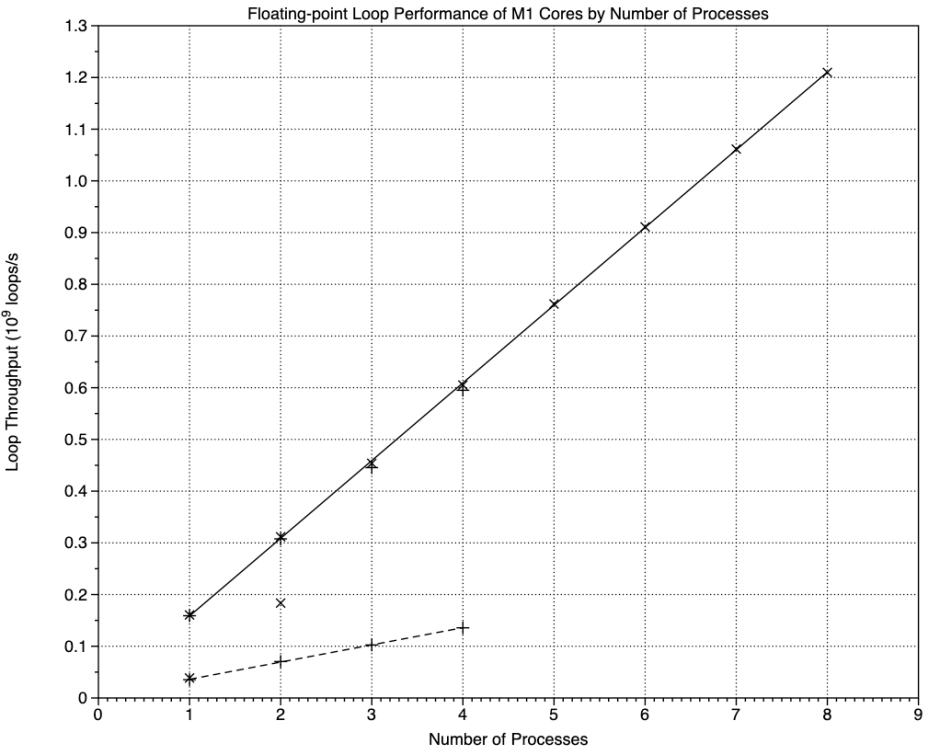
Results for the Floating-point test are similar in pattern, again with points which are tight on the regression lines. This time though the outlier of 2 processes on the M1 Pro E cores is more than twice that on the M1, and higher than a single process on the P cores.
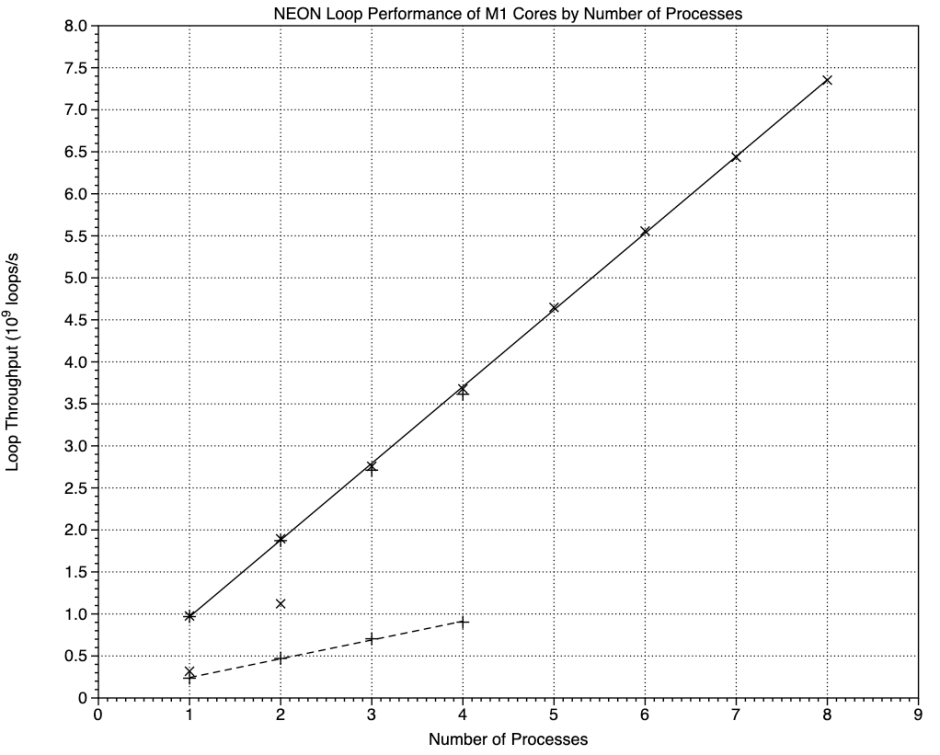
NEON performance is very similar to floating-point, with the M1 Pro outlier.

Accelerate also behaves similarly, but this time the M1 Pro’s performance with 2 E cores is almost the same as on a single P core.

I remarked in my last article that my final ‘mixed’ test didn’t behave as well as the others when used on the P cores, and that’s reflected in the scatter of data points, particularly with 5 processes and more. Despite that, it shows a similar pattern, with the M1 Pro two-process outlier closer to that seen in the Integer test.
Equations for each of the regression lines shown above are given in the Appendix below.
E core performance
There’s a clear difference in behaviour between the E cores on the original M1 and M1 Pro chips. With four E cores available, macOS runs them at performance substantially lower than the P cores when given high QoS processes. With only two E cores, when they’re loaded with two processes, macOS increases their performance to a level which exceeds that of all four E cores in the M1, even though the processes are run at the same minimum QoS.
Two major determinants of the relative performance of these cores are their architecture and clock speed. Work by Dougall Johnson, Maynard Handley and others has led to the proposal that an E core is essentially half a P core, so at the same clock speed you’d expect a P core to run these tests in roughly half the time as a single E core. Using that equivalence and the gradients of the regression lines in the previous graphs, it’s possible to derive an ‘equivalent clock speed’ for the E cores, relative to that of the P cores under a high QoS load which should be about 3.2 GHz.
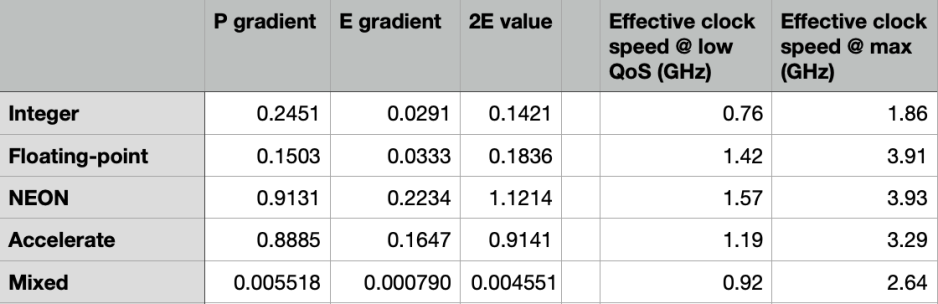
This table gives the gradients for the solid lines (P) and broken lines (E), which is the performance increment achieved by each added core of that type. The value of the performance of both E cores for the M1 Pro, the outlier points on each graph, is given in the third column. The effective clock speeds for the E cores on the M1 chip are then calculated from the E and P gradients, and that required to achieve the outlier, as the maximum ‘effective clock speed’ to explain that result. Note that the maximum clock speed reported for the E cores is just under 2.1 GHz, and any effective clock speeds above that aren’t likely to be actual clock speeds!
When loaded with processes at low QoS, the four E cores of the original M1 appear to be run at a clock speed of 0.8-1.6 GHz, well below their maximum of 2.1 GHz. When the two E cores of the M1 Pro are loaded with a single process at low QoS, they too run at those reduced clock speeds. But a second process at low QoS on the M1 Pro results in an increased clock speed which boosts performance.
The performance improvement seen on the M1 Pro’s two E cores varies according to the type of load. It’s lowest with code running in the ALU throughout, where it appears close to that expected from a real clock speed of 2.1 GHz. However, in code running predominantly in the Floating-point/NEON units, the effective clock speed is higher than the maximum of the P cores, requiring additional explanation.
It’s possible, although unlikely, that P core results for both the M1 and M1 Pro were attained with all the P cores running at less than their maximum clock speed of 3.2 GHz, despite those processes being given the maximum QoS throughout. If that were the case, then it would make performance testing extremely unreliable.
Conclusions
macOS manages background processes with minimum QoS quite differently on the original M1 and the new M1 Pro chips. On both chips, all such processes are confined to the E cores, even when there are only two E cores and all the P cores are essentially inactive. Background process are evenly loaded across all the E cores available in the cluster. A single process is then run with an effective clock speed of about half the maximum of the E core, in both the M1 and M1 Pro.
On the four E cores of the original M1, additional processes don’t appear to change the clock speed, so the difference in performance between E and P cores widens progressively.
In contrast, macOS manages the two E cores in the M1 Pro quite differently. When a second process is added, the performance of the cores increases as if their clock speed is increased, probably to their maximum of 2.1 GHz. However, additional performance improvements are seen in code predominantly run in the Floating-point/NEON units which doesn’t appear to be explained on the basis of clock speed alone. The overall effect is that running some processes on both E cores can be faster than on a single P core, with its higher maximum clock speed.
This suggests that macOS currently – in macOS 12.0.1 – adopts different strategies for these two M1 series chips. Even when used in a desktop Mac, the original M1 E cores appear to be managed primarily for energy efficiency. In the face of increasing load from background processes, they run those slowly. Only when processes are given a high QoS are the E cores run at higher clock speeds.
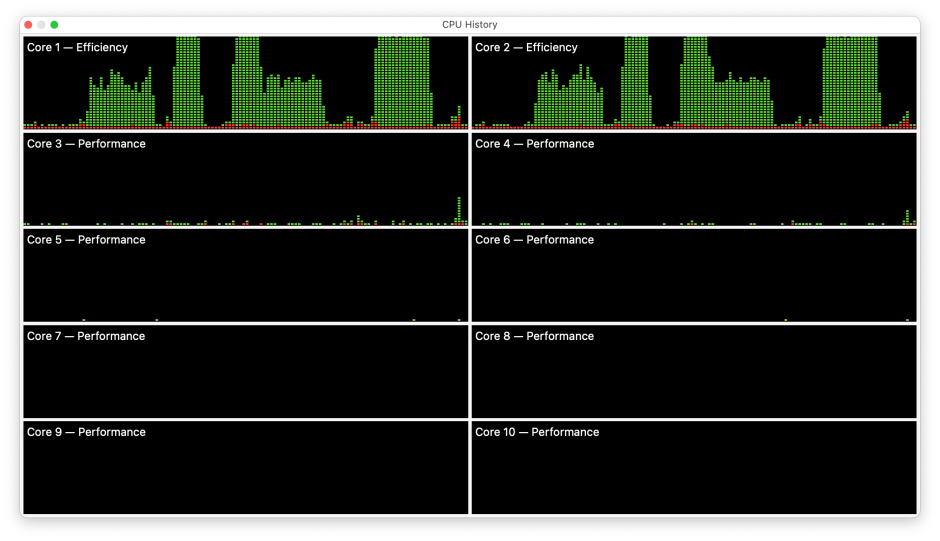
With half the number of E cores, macOS manages the M1 Pro chip more aggressively, increasing the performance of the E cores when they’re loaded with a second process. Looking back at the CPU History for three processes, above, once the load has fallen to that of a single process, the clock speed and performance appear to reduce again.
This emphasises again how assessing the performance of M1 series chips is much more complicated than conventional processors with homogenous cores.
I eagerly look forward to someone who knows what they’re talking about explain the performance boosts seen in Floating-point/NEON code.
Appendix: Equations of regression lines shown in graphs
Integer
- E 0.0018909 + 0.029141x
- P 0.014345 + 0.24511x
Floating-point
- E 0.0028444 + 0.033277x
- P 0.0083001 + 0.15025x
NEON
- E 0.019773 + 0.22343x
- P 0.053349 + 0.91313x
Accelerate
- E 0.01583 + 0.16468x
- P 0.05226 + 0.88853x
Mixed
- E 0.00011246 + 0.00078972x
- P 0.0031558 + 0.0055178x
