
Kernel panics, and anything else which causes your Mac to freeze completely or restart, are among the most difficult problems to diagnose. You may not even know when they happened: you just notice that your Mac restarted at some time when you weren’t there. There are also limited options as to what you can do to see what went wrong in the log. To use Console, as the event occurred in the past, you have to make a logarchive and open that. Trying to use the log command can be easier in that it can examine the live log, so long as you understand its complicated command structure and how to locate the panic.
This tutorial shows how you can use my free log browser Ulbow to identify and investigate this type of event. If you prefer using Consolation, please read this article as well, as it shows that app’s controls in use.
1. Get the best estimate of the time of the restart
If you witnessed the restart, make a note of the time that your Mac started up. If you weren’t present, and can’t work it out any other way, open System Information and select the Software heading at the left. This will reveal the Time since boot, which you can then subtract from the current clock time to establish roughly when that restart occurred.

2. Prepare Ulbow for browsing
Open the Ulbow app and set its controls to start browsing. In this case, ensure that Enable Chart View, in the Ulbow menu, is ticked so that you can use those. In the View menu, ensure that only the following commands are ticked:
- Get info messages
- Limit entries shown
- Show log entries.
These minimise the number of log entries which will be displayed when you get log extracts. By default, the number of log entries which will be shown when limited is around a thousand. If you want to change that, the control is at the foot of Ulbow’s Preferences dialog.

When you’re happy with those, make the settings your defaults so that each new window you open will use the same; to do that, use the Save as defaults command in the Ulbow menu.
3. Find the beginning of startup
In a new log browser window, set the time and date in the relative to control to around 30 seconds before your best estimate of the startup, and the Period to 2 min, so that the log extract should capture the first minute or more of startup. Set the style to basic+, leaving Predicate and filter set to none. Then click the Get log button.

Here I struck gold at the first attempt: nearly 200,000 log entries have been found, of which only around 1700 are displayed in the view below. Those, from the start of that two minute period, refer to processes being shut down in readiness for the restart.
To confirm this, and orientate yourself in time, use the Open Chart command in the Window menu to see the distribution of log entries over that two minute period. Note that this chart view plots all 200,000 entries, not just the 1700 or so shown in the limited log extract.

The Mac used here has a T2 chip, and is using Secure Boot with FileVault enabled. This results in a characteristic three-step restart:
- at the left are the many log entries immediately prior to shutdown;
- there’s then a period of log silence during the early boot phase;
- a small peak appears for the login screen;
- log silence resumes during the T2 phase of startup;
- once that’s complete, there’s a sustained peak of log entries marking the main startup phase.
Macs without a T2 chip or FileVault are simpler, with just a single silent period.
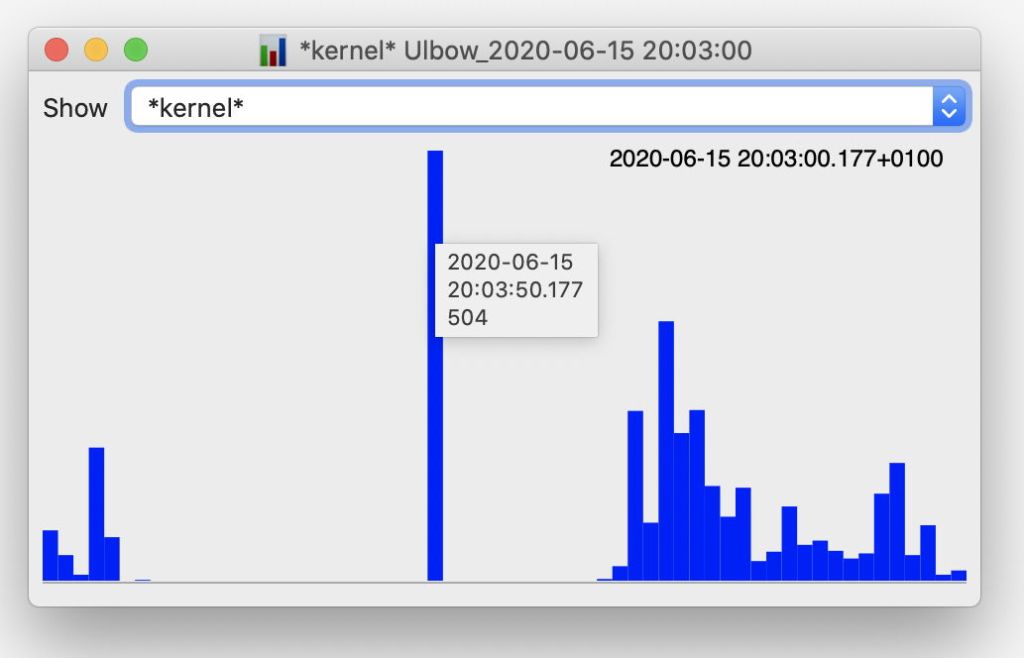
You can see this even more clearly if you switch the popup to show *kernel* entries.

Let the pointer hover over that centre bar and a tooltip pops up giving the date and time of the start of that period, together with the number of log entries there from that sub-system, here just over 500, which is typical for the login screen phase. One invaluable feature of the chart view is that it’s easy to set the date and time in one of Ulbow’s browser windows to any time taken from a chart view bar: simply Command-click on the selected bar to copy it. Do that with the first bar from this chart which you think indicates the beginning of startup.
Then open a new browser window using the New command in Ulbow’s File menu, click anywhere in the relative to date and time control, and Paste (Command-V). That sets the reference time to that displayed in the tooltip for that bar. Set the Period in that window to 10 sec (in Sierra you may need to make that longer, as the log can have problems retrieving entries for short time periods), and using other settings the same as in your first window, click on the Get log button.
4. Inspect the startup process
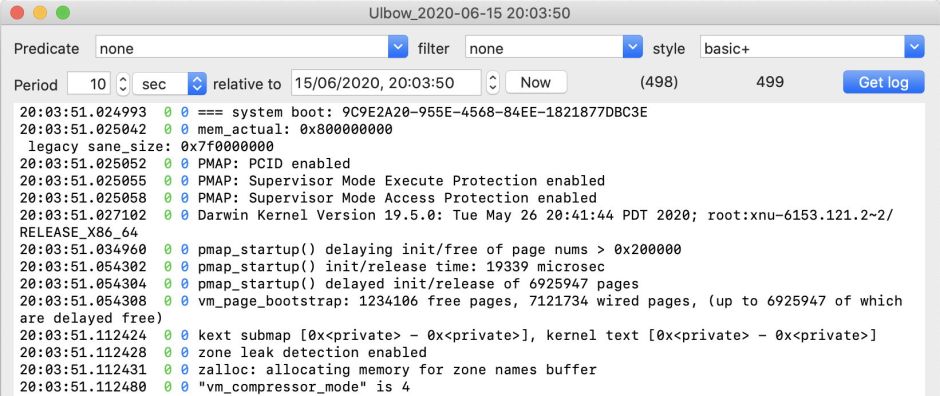
If you’ve hit the beginning of startup, you’ll now see entries such as
20:03:51.024993  0 0 === system boot: 9C9E2A20-955E-4568-84EE-1821877DBC3E

20:03:51.025042  0 0 mem_actual: 0x800000000

legacy sane_size: 0x7f0000000

20:03:51.025052  0 0 PMAP: PCID enabled

20:03:51.025055  0 0 PMAP: Supervisor Mode Execute Protection enabled

20:03:51.025058  0 0 PMAP: Supervisor Mode Access Protection enabled

20:03:51.027102  0 0 Darwin Kernel Version 19.5.0: Tue May 26 20:41:44 PDT 2020; root:xnu-6153.121.2~2/RELEASE_X86_64
In early versions of Sierra, the initial entry refers to BOOT_TIME instead.
If your browser window is a little later in the process, step the relative to time back a few seconds, and iteratively reach the starting point. You can always go back to the chart view and copy the time from a different bar.
The first entry in startup, with its characteristic === system boot: log message is an important landmark in the log. Tweak the time in that window to the same, and Get log again.
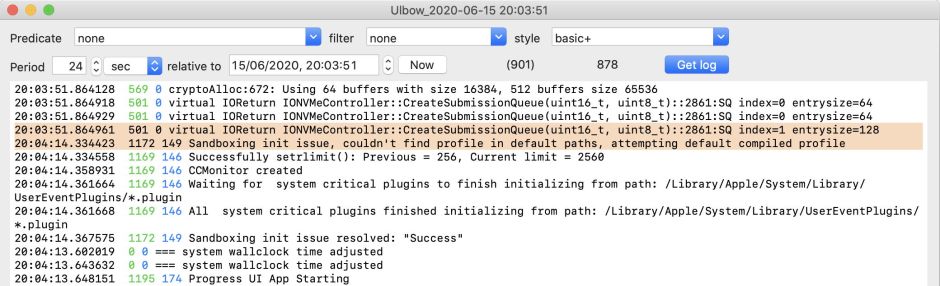
On my T2 Mac, it’s now easy to scroll down the relatively few log entries to discover the second long gap in the log, corresponding to the T2 phase of startup. Here the gap in entries lasts around 22.5 seconds. Soon after they resume, you’ll notice the characteristic clock time adjustment, another useful landmark.
5. Find the shutdown cause
One of the most important pieces of information you should discover from the startup is the reason for the previous shutdown. This is given in a message containing the word cause, so the next task is to locate that.
Ulbow provides two powerful methods for this. The first and more specific is to list just those log entries containing that word. Select the text currently in the filter combo box, remove it and replace with the word cause, then press the Tab key. This doesn’t get another log extract, but immediately shows only those log entries whose message contains that word.

Here it’s the first entry.
You can also use the normal Find command in the Edit menu. To do that, set filter back to none using the popup menu, then open the Find dialog using the menu command. Type the word cause in and click on the Next button.

Like any other Find, this will highlight the first appearance of the word in the text of the log entries that are displayed. The big differences here are that filter works only on text in each log entry’s message field, and displays all entries containing that word or characters. The Find command searches all the text you can see in that view, and continues to display all those entries regardless of their content.
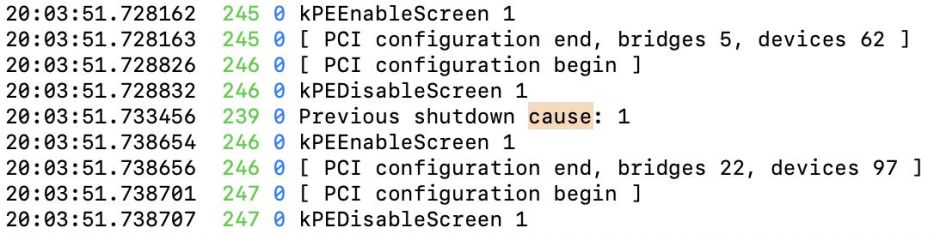
Cause codes like this are detailed in Ulbow’s Help book. If you haven’t already opened it, do so now using the Ulbow Help command in the Help menu. Go to the Contents page and click on the Cause codes item there. In the second page about them you’ll see a list of known shutdown cause codes. Although a code of 1 is relatively recent, it is essentially the same as 5, for a shutdown initiated normally by the user.
If you can’t find the shutdown cause, you may need to temporarily disable Limit entries shown, so that all log entries for the period are displayed. You may also find messages referring to a previous panic, and writing additional logs or a dump.
6. Examine the previous shutdown
Having established its cause, now’s the time to go back in time and browse the seconds before the panic occurred. Go back to your original chart showing the whole sequence of shutdown and startup. Identify the last bar before shutdown, Command-click to copy its datestamp, and paste that into a new log browser window’s relative to control. Set the Period there to -20 sec, which means the twenty seconds immediately prior to the reference time, and Get log.

You may now need to tweak the reference time setting one second at a time until you capture the last entry before log silence. It can help to reduce the Period to -5 sec and turn Limit entries shown off, stepping slowly until you reach the very last entry. Once you’ve got its time, set the reference time to the next whole second, the Period to -20 sec, and Get log.
To view some of the most important entries during this period, enter === in the filter box and press Tab. You might then see evidence of a more orderly shutdown sequence, such as
20:03:06.957483 com.apple.spotlightserver 5734072 171 ====^^^^ paired volume data media unmounted 0x7fa2b1040600

20:03:06.957527 com.apple.spotlightserver 5734072 171 ====^^^^ paired volume data media unmounted 0x7fa2b2014000

20:03:06.957539 com.apple.spotlightserver 5734072 171 =====^^^^ diskGoingAway forced:0 fromDiskArb:1

20:03:06.957553 com.apple.spotlightserver 5734072 171 =====^^^^ diskGoingAway forced:0 fromDiskArb:1

20:03:06.957818 com.apple.spotlightserver 5734734 171 =====^^^^^ Final Store Closed on Volume

20:03:06.957833 com.apple.spotlightserver 5734068 171 =====^^^^^ Final Store Closed on Volume

20:03:06.958626 com.apple.spotlightserver 5734072 171 ====^^^^ paired volume index location media unmounted 0x7fa29200b400 targetVolume:0x0

20:03:06.958685 com.apple.spotlightserver 5734072 171 =====^^^^ diskGoingAway forced:0 fromDiskArb:1

20:03:06.962088 com.apple.spotlightserver 5734098 171 =====^^^^^ Final Store Closed on Volume

20:03:06.962904 com.apple.spotlightserver 5734072 171 =====^^^^ diskGoingAway forced:0 fromDiskArb:1

20:03:06.970055 com.apple.spotlightserver 5734734 171 =====^^^^^ Final Store Closed on Volume

20:03:07.015608 com.apple.spotlightserver 5734064 171 =====^^^^^^ whyFail:-5, <private> 0x0

20:03:07.074029 com.apple.spotlightserver 5734064 171 =====^^^^^^ whyFail:-5, <private> 0x0

20:03:07.135167 com.apple.spotlightserver 5734069 171 =====^^^^^^ whyFail:-5, <private> 0x0

20:03:08.822309  0 0 === system wallclock time adjusted

20:03:08.822993 com.apple.spotlightserver 5734737 171 === tryShutdown, not clean count:2

20:03:08.895414 com.apple.metadata 5735124 1220 ==== XPC handleXPCMessage unknown error

20:03:08.903976 com.apple.metadata 5735102 93122 ==== XPC handleXPCMessage unknown error

20:03:08.959096 com.apple.spotlightserver 5733133 610 === tryShutdown, not clean count:1

20:03:09.023059 com.apple.spotlightserver 5734098 171 === processClean transaction:0x7fa2b2806e80, shutdownTimeStart:6.13941e+08 transaction:0x7fa2b2806e80

20:03:09.023095 com.apple.spotlightserver 5734098 171 === processClean - EXIT

20:03:09.031353 com.apple.metadata 5733697 1220 ==== XPC handleXPCMessage XPC_ERROR_CONNECTION_INVALID

20:03:09.236298 com.apple.spotlightindex 5734762 420 === processClean transaction:0x7fe9fad096e0, shutdownTimeStart:0 transaction:0x7fe9fad096e0

20:03:09.236302 com.apple.spotlightindex 5734762 420 === processClean - EXIT

20:03:13.652260  0 0 === system wallclock time adjusted

Exploring the exact sequence of events leading up to a kernel panic or similar takes more time. Use the same basic technique, using a reference time which marks the end of the log entries you want to view, with a negative Period determining the number of entries in the view, with limits turned off so long as you aren’t seeing thousands of entries. Use charts to look at specific subsystems to see where they went awry. I’ll look at some of those techniques in a further tutorial here.
7. Using Ulbow is different
Traditional techniques for browsing the log still work in Ulbow, but it has unique tools which are specifically designed to work with the unified log. You won’t find these in Apple’s underpowered Console, nor when using the log command. They make it much quicker to identify and navigate through its tens of thousands of entries, while still supporting tools such as filter predicates.
It’s relatively quick and simple to get a log excerpt covering a couple of minutes, limiting the entries displayed, and exploring the whole series using a chart. Chart view lets you see how active different sub-systems and the kernel were so you can hone in on a narrower period of interest.
Looking for anything among tens of thousands of log entries is unlikely to be successful, even when you know exactly what you’re trying to find. Limiting the number of entries displayed makes a big difference when you need to browse those entries.
Selecting entries to be displayed on the basis of filter terms is much quicker than using filter predicates, which are complex and prone to error.
Working with structured fields in log extracts is much preferred to unstructured text, and displaying them using different colours aids understanding.
