
There are two good reasons for wanting to browse your log: you know when something went wrong and want to find out what it was, or you know there’s something wrong, but don’t know what or when. In the first case, it shouldn’t be hard to go in using Ulbow, Consolation 3, or even the log show command if you enjoy that sort of thing, and you know roughly where to look. But what do you do if you don’t know what or when?
This article shows how you can use the latest chart feature in Ulbow, released in version 1.1b1 yesterday, to find a problem without knowing what to look for, or when to look.
I leave my iMac Pro running 24/7, and don’t even let it sleep. So a good time to look for persistent issues is when it should only be performing routine maintenance during the small hours of the morning. With any other log browser, checking all log entries over a period of an hour is futile unless you can home in on specific subsystems. Currently – and this was why I was keen to check my Mac – my log attracts between a quarter and half a million entries every hour even when I’m in bed asleep. Ulbow and Consolation can cope with getting those from the unified log, but looking through them using a conventional browser is futile.
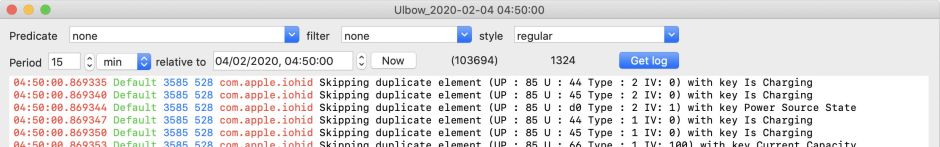
The first thing I did was to set Ulbow up to get all log entries for one hour, from 0330 to 0430. This takes a while, and you must ensure that you limit the entries to be displayed, say to around 1000, and Ulbow’s memory usage will rise from its idling 60 MB or so up to about 500 MB, but it works fine. Once it had got all those hundreds of thousands of log entries, I used its new Open Chart command in the Window menu to see the frequency pattern.

In my case, there’s a steady background chatter, as various subsystems like the Calendar sync periodically, and a huge spike of nearly 50,000 entries shortly after 0453. I then opened a New log window, and set that to look at just 15 minutes starting before that spike, at 0450.
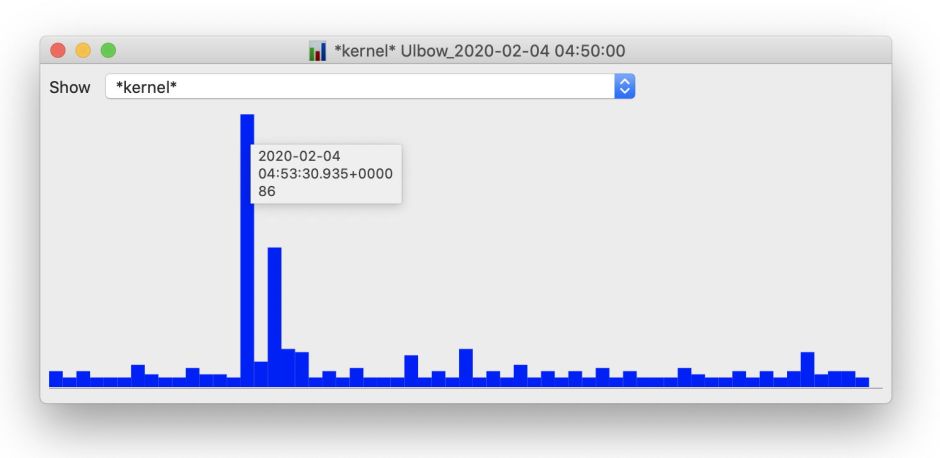
I opened a chart for this narrower time period. Clicking a couple of times on the chart view to make the bars a bit finer, I saw that most of those log entries occurred soon after 0453, and even the kernel pushed out over 80 log entries among them. This clearly needed a careful look.


At this stage, there are a great many subsystems to choose from, so I opened a new log window and captured just a short period from 04:53:39 onwards. I reduced that to just 2 seconds, during which there were over 31,000 log entries: that’s more than 15,000 log entries per second! With far fewer subsystems to choose from, it was clear that many of those entries were being written by the diskarbitrationd service.

Thankfully, the first few entries revealed what I was already suspecting, that this huge volley of entries was occurring during an automatic Time Machine backup. But checking the whole night using T2M2 showed that backups had occurred without error, and fairly briskly, as there was so little to back up when my Mac was inactive.
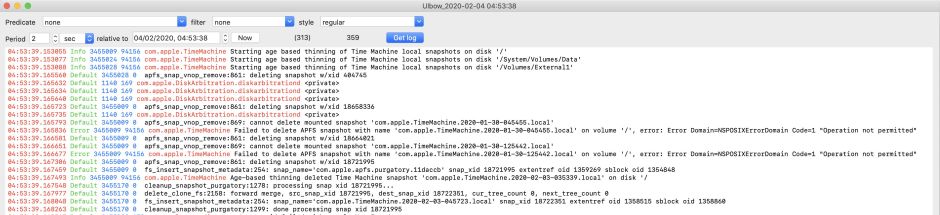
I then brought the time window a second earlier, to try to catch the start of the backup process, with the period still set at 2 seconds.

With just 313 log entries to browse, it wasn’t hard to find the cause of the problem, and the reason for so many entries by the kernel: one of the Mac’s old snapshots had got stuck for some reason, and couldn’t be ‘thinned’ or deleted.
In this particular case, I might have been able to guess what the problem was from browsing with the more detailed Time Machine predicate, but equally that could have proved a wild goose chase which never located these volleys of log entries. That’s exactly what Ulbow’s new chart view is for.
Tomorrow I’ll move on and look at the problem which I had just found: the snapshots which couldn’t be deleted.
