

Every couple of weeks, a user asks me what caused a crash or other problem with their Mac, and in almost every case my first suggestion is to look in the log to see what was recorded at the time. Before the advent of Sierra and the unified log, we were very used to doing this using Console. Sadly, Console doesn’t work like that any more, and if we do peek into the log it’s now full of all sorts of inscrutable nonsense. Most just don’t know what to do next.
This article shows you how you can access your log and discover what went wrong. If nothing else, by following these steps you can produce a log extract which others can interpret for you.
Make an immediate note of the time of the event
The only task which you must do as quickly as possible is to make a note of the precise time that the event occurred, to the nearest second. The unified log is a vast jungle of data, and trying to guess when anything occurred within a period of a few minutes can be tricky. Armed with the clock time, you have a period of at least a couple of weeks, usually 20 days or so, during which those entries will remain in your log. You can now take your time.
Download, install and prepare Consolation 3
Consolation 3 is available from its Product Page here. Download and unzip it, and put the app in your Applications folder. Within the folder you’ll see three customisation property lists, for Sierra, High Sierra and Mojave. Choose the one which is appropriate to your current macOS. Open Consolation, and use the Import Custom Settings command in the app menu to open that property list in Consolation. This imports a range of useful additions, most notably custom styles which you’ll find helpful.

You’ll also need to run Consolation from an admin user account: that’s a limitation imposed on the log show command which it uses, I’m afraid.
Set up for the log extract
Consolation has a bewildering array of controls which give it flexibility and power. Don’t be overawed by them: simply set each up as shown here.
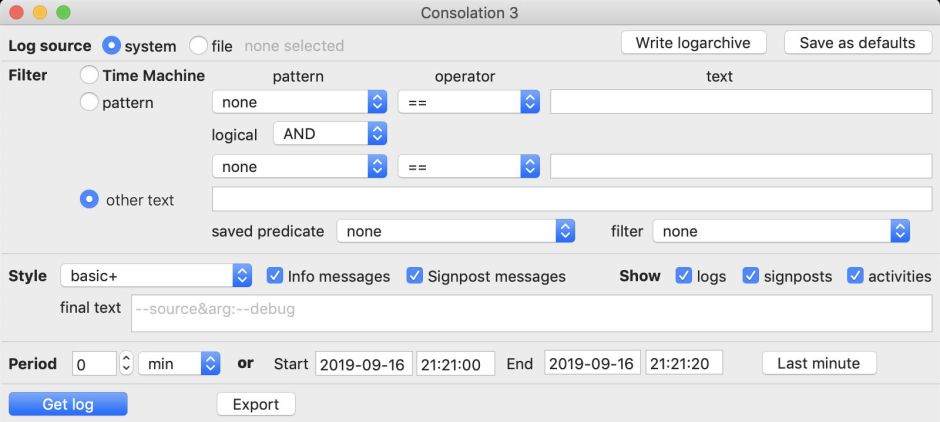
The Log source at the top should be set to system rather than file.
The Filter radio button should be set on other text, with the text box to the right of that empty.
In the Style section, set the popup menu to basic+, one of the custom styles which you just imported. Ensure the other checkboxes in that row are all ticked.
For the Period, set the first box to 0 (zero), then enter the Start and End times to cover the time of the event. Make the Start time just a second or two before the moment of the event, to ensure that you capture it, and the End time at least 20 seconds later. You might get away with a shorter period, but that can censor entries if you’re not careful, particularly in older versions of macOS.
Check the settings one more time, particularly the times and their formats, then click on the Get log button.
Browse the log extract
If you’ve got your settings right, after a brief pause the lower log view will fill with entries, and the area above it will show the elements assembled in the log show command which produced it. If you want to learn to access the log from the command line, this can be helpful.

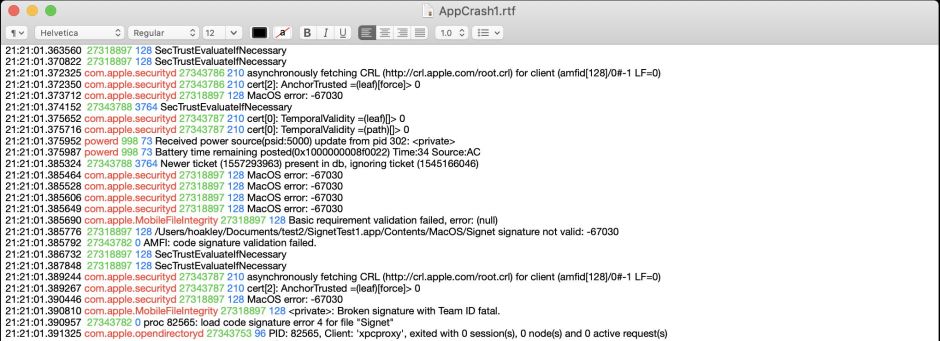
In this case, I opened a test app with a known signature error, which immediately crashed. Because this is a reproducible event, I double-clicked the app icon at 21:21:01, as close as I could make it, and set my log extract to run from 21:21:00 to 21:21:20. I didn’t have to scroll down far before I came across these two paired sendAction events which marked my double-click. They are the start of the process of opening my app.
You may find your log excerpt is full of signposts. If so, you can hide those from the display by unchecking the Show signposts box in the Style section. Unchecking activities there can be useful at times, but will hide the double-click event shown above.
I then scroll down the entries, watching various actions occur as the app is opened. Not too far down is the sudden crash.

There’s an initial pair of entries recording the trust evaluation, and shortly after them a MacOS error -67030, which runs on through other entries until com.apple.MobileFileIntegrity decides that this is fatal.
Although you’ve got another couple of weeks in which you can return to this moment in your log, I normally save the output not as regular text, but as Rich Text, retaining its colour. You might want to include more detail, perhaps by switching the Style to a more detailed option. The Rich Text file will contain the same entries and fields as are currently displayed in Consolation.
When you’re happy, use the Save command in the File menu, ensuring that you set the File Format to Rich Text (RTF).

You can now open that log extract in any RTF editor such as TextEdit or, of course, DelightEd, and edit or study it to your heart’s content.
The Consolation product page contains links to many articles here which take your exploration of the log further, and will help you interpret what you find. The app itself has a long and detailed Help book which explains all its features, and contains a lot of other useful information. Happy hunting.
