
Unlike traditional logs, most of the content of the unified log in Sierra and High Sierra is structured into data fields, and extracts from the log are made on the basis of field content, filtered by predicates.
Unfortunately the log command doesn’t support custom output formats: it has only two readable formats, one similar to the standard syslog, the other new for this system. Output is also available in a verbose JSON format, suitable for reading into bespoke apps. Output fields can, however, be customised in the Console app, which is one of its few attractions.

Consolation 3 and Woodpile can work in either of the two standard formats, or can obtain log extracts in JSON for custom formatting, including the use of colour to distinguish different fields. Consolation can also export all fields in CSV for import into other apps.
Log fields
The fields available for each log entry are:
- timestamp, in full, 2017-07-26 20:24:59.326229+0100
- machTimestamp, in system ticks, 608403543041193
- messageType, Default
- category, security_exception
- subsystem, com.apple.securityd
- processUniqueID, 156
- threadID, 868
- traceID, 833721519476834308
- senderProgramCounter, 193733726
- processID, 156
- eventMessage, MacOS error: -67062
- processImagePath, /usr/libexec/taskgated
- processImageUUID, 4F6F0B24-7A18-3AF9-853F-8F72F6C7D7C7
- senderImagePath, /System/Library/Frameworks/Security.framework/Versions/A/Security
- senderImageUUID, 005E8C96-40B6-35E3-B58B-888A5F5957C2
- timezoneName, may be blank.
Many log entries don’t contain a full set of fields.

The eventMessage field can contain very long, multi-line text which can make browsing in any format quite difficult.
Consolation 3 and Woodpile use custom formatting strings to determine the inclusion, order, and formatting of log entries. Long text fields such as eventMessage can be truncated, and the timestamp shortened to time alone, for example. The formatting string simply specifies which fields (0-15) and where colours are to be used, e.g.
0h 2g 6 9 4b 3 11fr 13fg 10
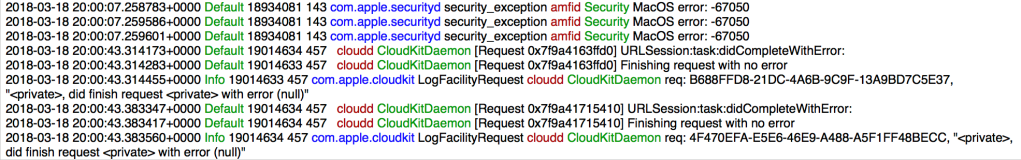
displays the timestamp without the date in black, the messageType in green, threadID and processID in black, the subsystem in blue, the category in black, the processImagePath truncated to just the file name in red, the senderImagePath truncated to just the file name in green, and the eventMessage in black.

Extraction
Selecting and filtering a log extract is complex, and the crux in using the unified log. As the log can store tens of thousands of entries per minute, the most common and largest problem in accessing it is becoming overwhelmed with entries. It is not so much looking for a needle in a haystack as looking for one needle in many haystacks.
The first decision is whether to work on the live log in /var/db, or to make a logarchive of what is there and work on that. Logarchives can be made using
log collect
or by buttons in Consolation 3 and Woodpile. Although you can specify a maximum size, that option hasn’t worked reliably since macOS 10.12, and the only real options are the period. Consolation simply packages up all the current logs into a logarchive of around 700 MB, which for most purposes is better than trying to guess the required period.
One shortcoming is that no tool can currently extract log entries from isolated tracev3 files (outside a valid logarchive or /var/db folder structures), so unless you obtain a full logarchive, you cannot view or analyse the log from a Mac or iOS device. Both Consolation 3 and Woodpile can analyse individual tracev3 files, but only within a logarchive, which is the limitation imposed by the log command. I am assured by the forensics community that this only very rarely poses them a problem.
Next, for the live log or your logarchive, you need to arrive at a suitably filtered extract over a defined time period, so that you include the event that you want to locate, but exclude as many extraneous entries as possible. This is the art of unified log reading.
Time periods for extracts can either be given as the last X seconds/minutes/hours/days, or with defined start and end datestamps. When working on a live log, the former can be useful, but in general datestamps are better because they are absolute.
Unless you’re applying very specific predicate filters, which you know will return few entries, avoid using long time periods, as the quantity of data will simply overwhelm. If you’re viewing all entries, then anything more than a minute is going to be of limited value.
Predicates
The log show command filters log entries for you on the basis of logic rules applied to individual fields of the log entries – predicates, which Apple uses in several other parts of macOS. Each term within a predicate sets a logical condition which must be fulfilled for the entry to be included in the output. For example,
subsystem == "com.apple.duetactivityscheduler"
requires the contents of the subsystem field to equal exactly the string com.apple.duetactivityscheduler
Those terms are then assembled into a complete logical condition such as
subsystem == "com.apple.duetactivityscheduler" || subsystem == "com.apple.xpc.activity" || (subsystem == "com.apple.TimeMachine" && eventMessage CONTAINS[c] "start")
That filters entries which satisfy the following logical criteria:
- the contents of the subsystem field are exactly
com.apple.duetactivityscheduler, or - the contents of the subsystem field are exactly
com.apple.xpc.activity, or - ((the contents of the subsystem field are exactly
com.apple.TimeMachine) and (the contents of the eventMessage field contain, case insensitive, the stringstart))
Designing powerful predicates therefore requires considerable experience of unified log content, knowledge of the content of its special fields such as subsystem, and a painstaking logical approach. As log content is essentially undocumented by Apple and there is no catalogue of subsystems, for example, you will largely proceed by guesswork.
Consolation 3 (but not Woodpile) allows you to build and use your own library of custom predicates, which can be as complex as you wish.
Apple’s Predicate Programming Guide is the reference on predicates, but does not mention or illustrate their use with the unified log.
String search
Each time that you want to filter log extracts using a different set of predicates, you have to repeat the log command, which often takes time to return the next extract. When you’re trying to build a powerful filter, starting from the general and becoming more specific, this can be time-consuming and frustrating.
Consolation 3 and Woodpile include conventional search strings, which are applied to the eventMessage field, and don’t require a fresh log extract. These make log exploration much quicker and more flexible. You could, for example, filter a log extract using quite a general predicate which returns several thousand entries in the specified time period, then filter those using a string, such as kernel or fail, down to a more manageable volume.
Consolation 3 supports both plain string and regex filtering. The log command and Console support neither, although you can always write your own for log output.
Top-down search
Console, log, and Consolation all work best when you know exactly what you are looking for, and when it happened. If you think there’s a performance issue, or aren’t really sure when an event occurred, you will waste a great deal of time with them.
When I was working out the structure of logarchive files and the live log last year, I stumbled across logd‘s logs, which are among those not accessible using any log browsing tool. Each time logd rolls a log file, it generates a statistical summary of log activity over the period covered by that log file, and writes it to its log, together with various other messages relating to its housekeeping activities.
Woodpile examines the contents of a logarchive, and extracts the statistics from logd‘s log files, which together can stretch back for over two months, although tracev3 log files normally only cover the last few weeks of that period. Those statistics cover the processes which have been responsible for the greatest volume of log entries, what I term log load.
This allows you to look at log load over time, and zoom in on individual log files containing ‘interesting’ events, in which certain processes such as the kernel had high loads. You can then zoom in further until you identify an interesting period, and view log entries over that period. Used in conjunction with Consolation 3, these are powerful tools for identifying problems which you do not have detailed information about.
