

It’s not very often that you stumble across previously unknown metrics which are built into macOS, and which can give useful insight into the activity and performance of processes. Here’s a new one: log load.
As I wrote in my recent account of the unified log in Sierra and High Sierra, log maintenance is performed by the daemon logd, which generates its own log files outside the unified log system. In a live log, these are kept as plain text files in /var/db/diagnostics, and named much like traditional logs, logdata.statistics.0.txt, and so on in numerical sequence.
When logd performs certain types of maintenance on tracev3 log files, it records statistical summaries of their contents in its log. As those files are also collected in logarchives generated from live logs, they are amenable to further analysis. I don’t know whether logd maintains similar logs in iOS, watchOS, and tvOS, but suspect that it may well do.
In that previous article, I gave an example of the statistical analysis recorded in the log log. I have now added a feature to my logarchive tool MakeLogarchive which gives easy access to those log logs in any valid logarchive. This new version is available here: mla5
and in Downloads above.
This new feature is easy to use. The best way to explore this is to create a logarchive from your live logs, although that will typically be a bundle of around 500 MB in size: use the Copy for Consolation button to do that, and save the logarchive somewhere accessible. Next, click on the Analyse button, select your new logarchive, and MakeLogarchive will display a human-readable summary of the main log files (those in the Persist folder) recorded in the log log.
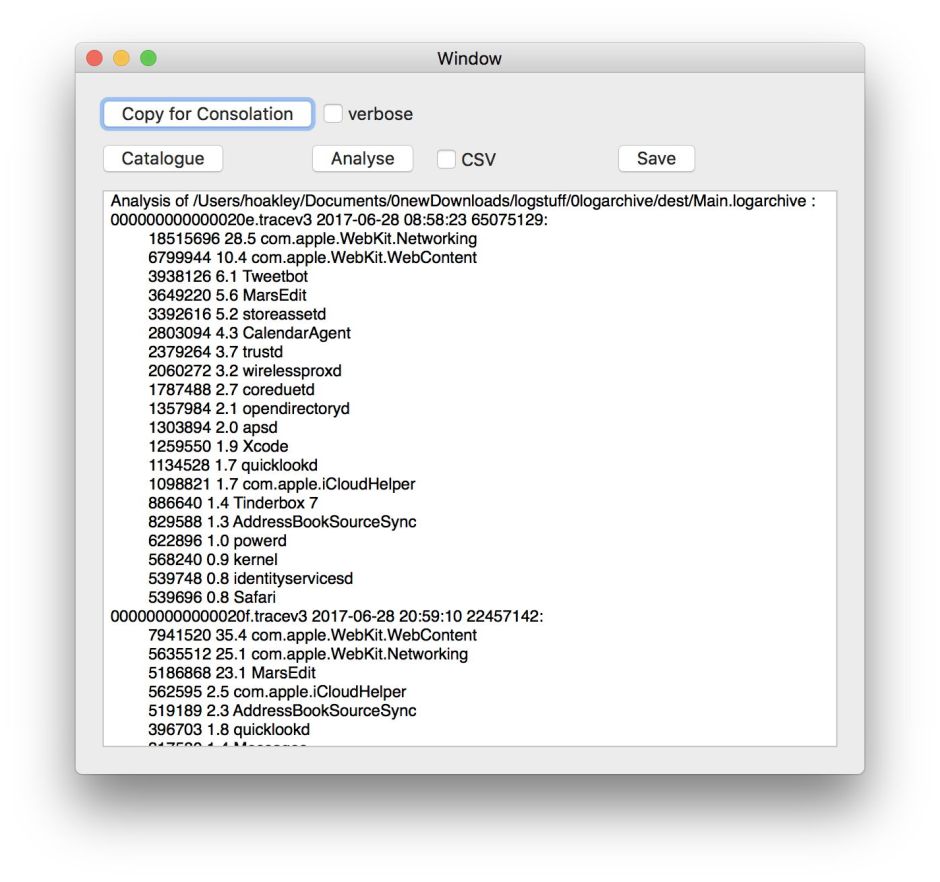
These analyses are displayed in chronological order, with the oldest at the top. You’ll immediately notice that these summaries go back much further than the logs: in my case, for over three months, to late June.
The figures shown are what I call the log load. Having studied them carefully, they are not the number of log messages or entries, nor are they the compressed size in the tracev3 file. I believe that they are the uncompressed log sizes in bytes, although even that assumes highly efficient compression in the tracev3 format.
By and large, they represent the proportion of log entries made by the named process, which is given in the second figure in each line as a percentage of the total for that particular log file.
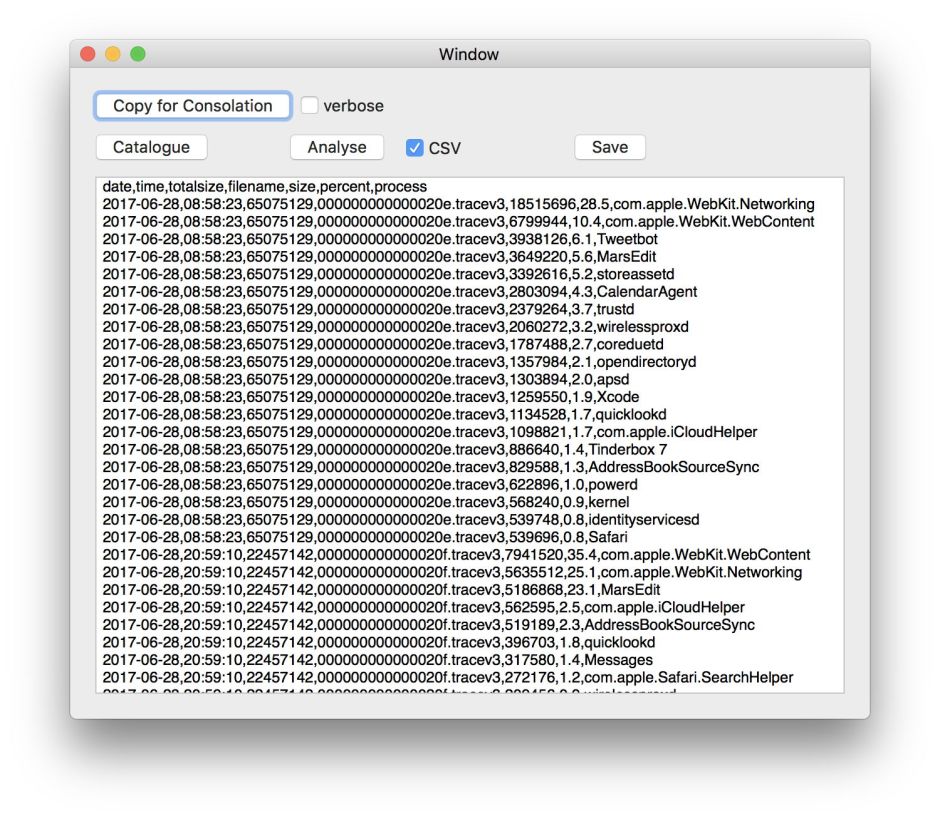
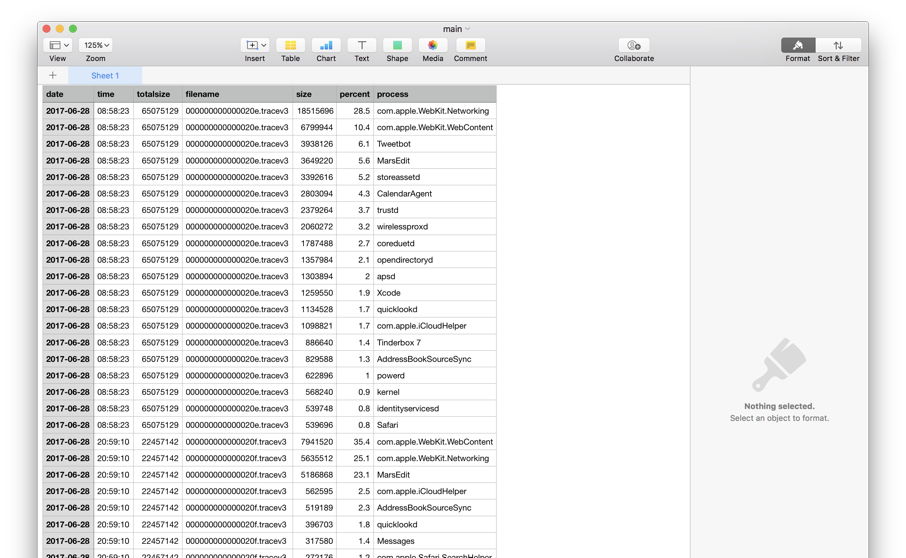
If you want to analyse them using a spreadsheet, tick the CSV checkbox, and MakeLogarchive will analyse them to CVS format, which you can easily import into Microsoft Excel or Numbers.
There are some minor snags. I don’t know whether this is a bug or feature, but logd doesn’t always generate statistical summaries when it rolls the logs. Compare the logs analysed here with the catalogue available in MakeLogarchive, and you’ll see that not all the Persist log files are included in the statistics.
Not all log entries go into Persist logs either: some only stay in memory, and are not written to disk, and others are written to Special log files, which I do not currently analyse as they overlap with Persist logs, and are weeded more quickly.
The log load is obviously influenced by the activity of a process, by the frequency with which it writes to the log, and by the verbosity of its log entries. There’s no personal or sensitive information here, but patterns of log load could clearly be related to app use, as well as the use an app makes of the unified log. I suspect that log load figures may be of interest to many developers, and anyone wishing to look more deeply inside macOS.
Now you can study it.
